17 - Tutorial: plot graphs using R
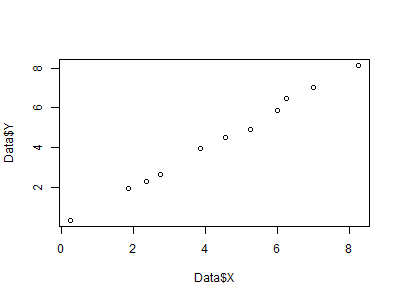
Hi crew, Ready for a new post? Today, as I promised, I want to introduce you to plot graphs using R. R is a software that offers a large variety of solutions for plotting beautiful and fully customizable graphs and is the software that I use for my data analysis in my project. Let’s start then this brief tutorial. The dataset I will use is actually completely random, but of course, you can use any other you want. #this is a comment in R #let’s start assigning values to our ‘x’ and ‘y’ Data <- data.frame ( "X" = c(0.25, 1.85, 2.35, 2.76, 3.85, 4.55, 5.25, 6, 6.25, 7, 8.25), "Y" = c(0.35, 1.95, 2.28, 2.68, 3.97, 4.5, 4.9, 5.85, 6.48, 7.01, 8.15)) Another way to do that can be: x <- c (0.25, 1.85, 2.35, 2.76, 3.85, 4.55, 5.25, 6, 6.25, 7, 8.25) # assigns a vector to the variable ‘X’ y <- c (0.35, 1.95, 2.28, 2.68, 3.97, 4.5, 4.9, 5.85, 6.48, 7.01, 8.15) # assigns a vector to the variable ‘Y’ Data <- data.frame ( ...